Top 10 Candlestick Patterns to Use in Trading Forex and Crypto
Evertise
08 May 2022, 14:54 GMT+10


The candlestick charts are ancient forms of technical analysis used by traders. If you are keen to learn crypto trading, you must understand the concept of chart patterns. Candlestick charts help to visualize the price movement of cryptocurrencies and forex. They help to identify trading opportunities and analyze trading patterns.
Typically, they consist of boxes and lines showing high, low, open, and close of particular trading sessions. Candlesticks have specific colors that help identify their patterns and the size of the move. This guide will explore the best candlestick patterns to help you make an informed decision.
Top 10 Candlestick Patterns
- Hammer
- Hanging Man
- Evening Star
- Doji
- Marubozu
- Bullish and Bearish Engulfing
- Piercing
- Tweezer Top
- Tweezer Bottom
- Spinning Top
Hammer
The hammer consists of a short body and a long tail. It is a bullish signal showing that buyers are back in the market and end in a downwards trend. Its body color can vary though green hammers offer more robust bull markets than red hammers.
The hammer occurs when the price makes a quick vertical move in the opposite direction from the previous day's trading range. Mostly, it appears after an asset price drop, which is an excellent time to buy bitcoin.
Hanging Man
The hanging man has an opening and closing prices near each other with a long tail resembling the hammer. Despite the long tail, it is a failed bearish signaling that the trend may soon reverse. It is a warning sign for buyers to pull out of the trade with some profit instead of anticipating further gains. For sellers, it is a good entry point after considering other factors.
When the closing price is lower than the opening price, it indicates the market is ready to move lower. Although it can have a bearish or bullish body, it provides the same price direction.
Evening Star
The evening star comprises three candle formations, a large green candle, a small candle, and a large red candle. The large green candle indicates bulls taking over, pushing the market to new heights. The small candle shows a continuation of the run but lacks strength explaining its small size. The last candle signifies the disappearance of gains made from the first candle.
The evening star allows a trader to identify a bearish turn in the market. The opening of the large red candle help traders to stop losses while its end shows the time for sale.
Doji
The Doji pattern occurs when the opening and closing prices are at the same level, accompanied by a long tail. It happens because bullish traders push up the prices at the market opening. Consequently, bearish traders reject the high prices forming the Doji candlestick.
The top of its tail shows the highest price while the bottom, the lowest price. When the upper and lower shadows are the same, Doji forms a cross pattern. Doji is a state of neutrality and thereby adds no market value to traders.
Marubozu
The Marubozu is a single candlestick without tails. The rectangular block is easy to spot and helps predict future asset prices. It usually happens after a downward trend and depicts a bullish reversal. Sellers need to close their shorting position upon its formation to avoid losses.
A green Marubozu is bullish and signifies strong convictions among the buyers. On the other hand, a red Marubozu is bearish and shows strong beliefs among sellers. A full Marubozu displays the interests of traders to buy or sell depending on its color.
Bullish and Bearish Engulfing
The bullish engulfing occurs where the bull candlestick outweighs the bears. It means the bull candlestick is longer than the bear. Typically, it happens after a significant downtrend. Its formation shows that traders will enter a long position and can place a stop at the lowest point of the second candle.
The bearish engulfing occurs when the red candlestick engulfs the small green one. It happens at the end of an upward trend and signifies a market downturn.
Piercing
The piercing pattern happens when a bullish candle (second) closes above the midpoint of the bearish candle (first) during a downturn market. The first candle shows a progression of a downward trend while the second candle closes beyond the 50% threshold of the body of the first candle.
Traders enter a long position on the formation of the bullish candle. Moreover, you can place a stop at the lowest point of the second candle.
Tweezer Top
The tweezer top consists of several candles appearing at the end of an upward market. The bullish candle appears first, followed by the bearish candle. It shows a strong bullish market whose prices reduce to finish with a bearish candle the next day. The occurrence indicates the discovery of discounted prices by bears and increased interest in the opening position.
Tweezer Bottom
The tweezer bottom is the opposite of the tweezer top pattern. Here, the bullish candles appear at the end of a downward market. The bears have an aggressive price which rebounds the next day due to buyers' interests. Once the second candle closes, traders seize the opportunity by rushing to buy bitcoins. The two tweezer patterns indicate a reversal in the market trends.
Spinning Top
The spinning top has closing and opening prices close to each other, making them short in size. The tails appear on both sides of the body at nearly the same length. This shape occurs due to indecision in the market. When the bulls set the prices high, the bears bush it downwards, thereby having no meaningful price variations.
Final Thoughts
No single pattern can always yield desired results and high returns. It is the reason understanding different candlestick patterns is essential for newbies and veterans in crypto and forex trading. Try out the above charts to maximize value, avoid losses, and become profitable.
 Share
Share
 Tweet
Tweet
 Share
Share
 Flip
Flip
 Email
Email
Subscribe and Follow
Get a daily dose of Austin Globe news through our daily email, its complimentary and keeps you fully up to date with world and business news as well.
News RELEASES
Publish news of your business, community or sports group, personnel appointments, major event and more by submitting a news release to Austin Globe.
More InformationWall Street diverges, but techs advance Wednesday

NEW YORK, New York - U.S. stocks diverged on Wednesday for the second day in a row. The Standard and Poor's 500 hit a new all-time...
Greenback slides amid tax bill fears, trade deal uncertainty

NEW YORK CITY, New York: The U.S. dollar continues to lose ground, weighed down by growing concerns over Washington's fiscal outlook...
Taliban seeks tourism revival despite safety, rights concerns

KABUL, Afghanistan: Afghanistan, long associated with war and instability, is quietly trying to rebrand itself as a destination for...
Nvidia execs sell $1 billion in stock as AI boom drives record prices
SANTA CLARA, California: Executives at Nvidia have quietly been cashing in on the AI frenzy. According to a report by the Financial...
Tech stocks slide, industrials surge on Wall Street
NEW YORK, New York - Global stock indices closed with divergent performances on Tuesday, as investors weighed corporate earnings, central...
Canada-US trade talks resume after Carney rescinds tech tax

TORONTO, Canada: Canadian Prime Minister Mark Carney announced late on June 29 that trade negotiations with the U.S. have recommenced...
Mexican President orders review of SpaceX environmental impact

MEXICO CITY, Mexico: Mexican President Claudia Sheinbaum said this week that her government is investigating possible environmental...
Sam’s Club fulfillment center to shut in Texas, jobs impacted

NEW YORK CITY, New York: Walmart is set to close a major Sam's Club fulfillment center in Fort Worth, Texas, as part of a shift in...
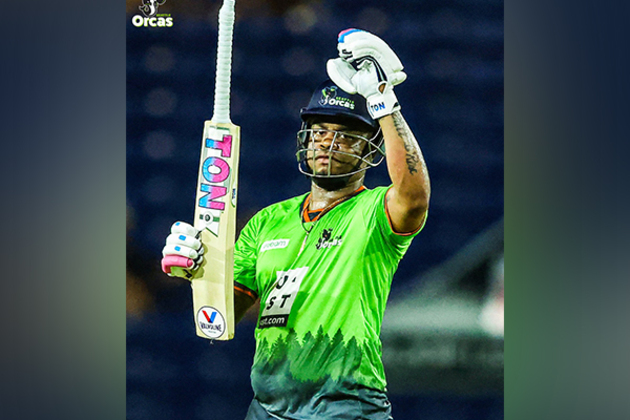
Unstoppable Hetmyer delivers again as Orcas make it three in a row
Broward County [Florida], July 2 (ANI): Left-hand batter Shimron Hetmyer's unbeaten 78-run knock guided Seattle Orcas to victory over...
Dwayne Johnson recalls emotional connection Jelly Roll's song 'Only', says "the lyrics rocked me"
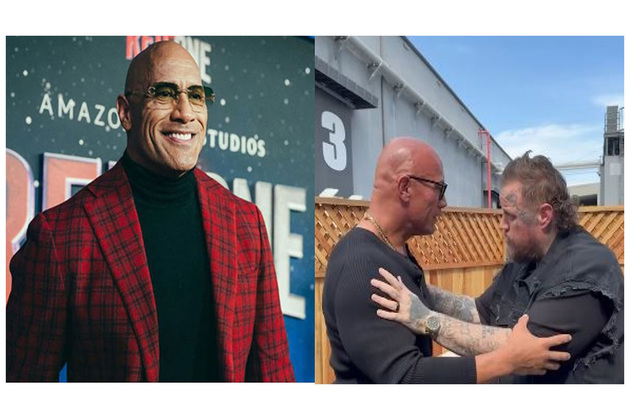
Washington DC [US], July 2 (ANI): Actor Dwayne Johnson has a very special bond with singer and rapper Jelly Roll, and in fact, his...
NASA astronaut Anil Menon to embark on his first International Space Station
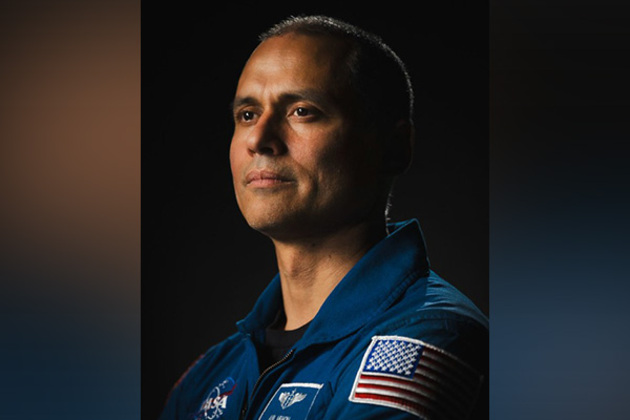
Washington DC [US], July 2 (ANI): NASA astronaut Anil Menon has been assigned his first mission to the International Space Station,...
"This is a film from India, for the world": Anupam Kher shares heartwarming response to 'Tanvi The Great' trailer, global premieres

Mumbai (Maharashtra) [India], June 30 (ANI): Anupam Kher's upcoming directorial 'Tanvi The Great' is creating a buzz in the entertainment...